
Voltage Flicker and Voltage Fluctuations in power quality measurements
Flicker refers to the perceived fluctuation in light intensity that occurs when voltage fluctuations impact lighting systems. It is often caused by rapidly changing loads in the electrical network. It can be visually discomforting and can affect the performance and lifespan of sensitive equipment, especially in industries that rely heavily on precise lighting conditions or use sensitive equipment.
What is Flicker and voltage fluctuations
Flicker is characterised by voltage variation typically within the range of ±10%. These voltage fluctuations occur multiple times over a specific period, resulting in perceptible changes in light output. The variations can happen at irregular intervals and may differ in duration and intensity. The frequency of the variation, often measured in cycles per second or hertz (Hz), determines the rapidity of the flickering effect. A higher frequency of voltage fluctuations can lead to more pronounced flicker, which can be particularly noticeable in lighting systems where rapid changes in brightness can be visually disturbing.
Flicker Effects
| Flicker Effects | Source of Flicker | Frequency |
| Headaches/Visual Effects | Low frequency fluorescent | 100Hz |
| Neurological Effects | Amplitude moderated flickering light | 20 – 75Hz |
| Seisures in photosensitive epileptics | Various | Various |
| Unperceived neurological effects | Light-emitting diode | Up to 200Hz |
| Unperceived retinal effects | Various | 76 – 162Hz |
| Visual Effects | Computer monitor | 70 – 110Hz |
Flicker Measurement
In accordance with the international electro-technical standard IEC 61000-4-15, the specifications for flicker measurement equipment are meticulously outlined. This standard establishes the framework for evaluating voltage flickering, ensuring a consistent and universally accepted method.
A flicker meter comprises multiple functional blocks designed to replicate the characteristics of a 230V/60W incandescent lamp (referred to as the reference lamp) and the intricate dynamics of the human perception system, modeled on the eye-brain interface.
The assessment of flicker involves deriving momentary values, from which Perceptibility Short Term (PST) is calculated using a statistical process over a standardised 10-minute observation interval. Simultaneously, the long-term flicker (PLT) is calculated as the cubic mean of multiple PST values over a standardised two-hour period. The calculation and scaling algorithm for the perceptibility value are intentionally crafted. A PST value of 1.0 is strategically aligned to a level at which 50% of test subjects perceive the flicker to be both noticeable and irritating. This ensures that the measurement is not only objective but also reflective of the human experience with flickering.
Quantifying Flicker
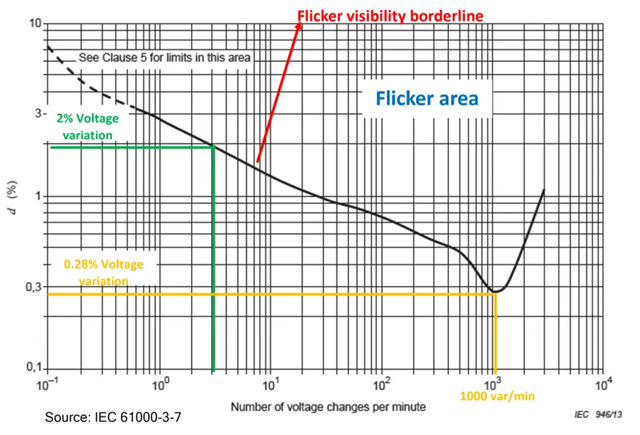
The calculations for PLT and PST both use the voltage variation and the number of switches to measure how they impact on the level of flicker.
Voltage Variation
The voltage variation, expressed as a percentage, represents the magnitude of the voltage fluctuations within a given time period. A higher voltage variation can result in more significant effects, as the changes in voltage levels have a more noticeable impact on the lighting system.
Number of Switches
The number of switches refers to the frequency or rate at which the voltage fluctuations occur. A higher number of switches indicates that the voltage is changing more frequently, potentially leading to a more pronounced flicker effect.
The timing and duration of these switches can impact the perceived flicker characteristics. Both the voltage variation and the number of switches contribute to the overall flicker level. While the voltage variation determines the magnitude of the fluctuations, the number of switches influences the frequency and pattern of the flicker. It is important to consider both aspects when evaluating and mitigating flicker issues in lighting systems to ensure a comfortable and visually stable environment for users.
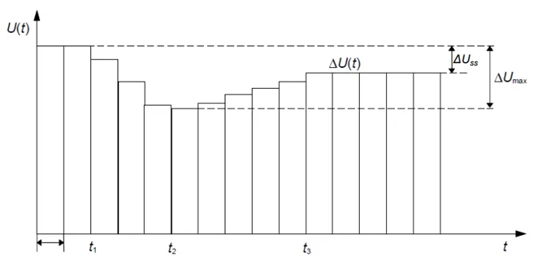
Rapid Voltage Changes (RVC) due to Switch-on Phenomenon
Rapid voltage changes can occur due to the switch-on phenomenon, where the voltage experiences sudden changes. In normal situations, the ΔUss (Steady State voltage variation) is limited to a maximum of 10% of the nominal voltage (Un). However, in situations without production stops, significant loads, or connections, the ΔUss is further restricted to be smaller than or equal to 3% of Un. Additionally, the ΔUmax (maximum voltage variation) is also constrained to be smaller than or equal to 5% of Un in situations without production stops, big loads, or connections. These limitations ensure stable voltage levels and minimise disruptions, providing a reliable electrical environment for operations.
Voltage fluctuation due to active AND reactive power
The equation Δ𝑈=𝐼⋅𝑅⋅cos𝜙+𝐼⋅𝑋⋅sin𝜙 describes voltage variations that occur due to both active power (real power) and reactive power in an electrical system.
where,
Δ𝑈 represents the voltage variation, which is the difference between the actual voltage and the nominal voltage.
𝐼 represents the current flowing through the system.
𝑅 represents the resistance in the system.
𝑋 represents the reactance in the system.
cos𝜙 represents the power factor, which is the ratio of the real power to the apparent power.
sin𝜙 represents the reactive power factor, which is the ratio of the reactive power to the apparent power.
In simpler terms, this equation suggests that the voltage variation is influenced by the current flowing through the system, the resistance, the reactance, and the power factors (both real and reactive). By considering these factors, the equation helps in understanding and predicting voltage fluctuations that can occur in electrical systems due to both active power and reactive power components.
Learn more about our products and services by visiting our Power Quality Expert product catalogue, Sonel product catalogue , Electrex product catalogue or Elspec product catalogue or you can contact us to discuss your measurement requirements further.
You can also follow Power Quality Expert on LinkedIn for regular news on products, events and technical updates.